
FeaturesWatchlists

3 min read

Keep your finger on the pulse of every potential investment

A smart radar for the assets you are watching long before you buy. Build your own lists, gauge market sentiment and never miss the right moment to enter a position.

Unlimited lists
1m / YTD / 1y history
Target entry prices

Turn casual watching into systematic analysis

Every potential trade is tested against time and numbers before you commit any real capital.

Personal lists

Group assets by sector, by idea or by priority — create as many lists as you need for different strategies.

Historical performance

Price performance over one month, year to date (YTD) or a full year (1y) — the wider context behind every move.

Change since you added it

See how far the price has moved since you added the asset to a list — and spot the genuine discounts on the market.

Target prices

Set your own target price for every asset, so you know exactly when you are ready to move it into a real portfolio.

Live volatility

Daily percentage change for every ticker, plus the overall return of the whole list in real time.

Full detail

Company name, current market price and the date you first flagged your interest — all in one view.
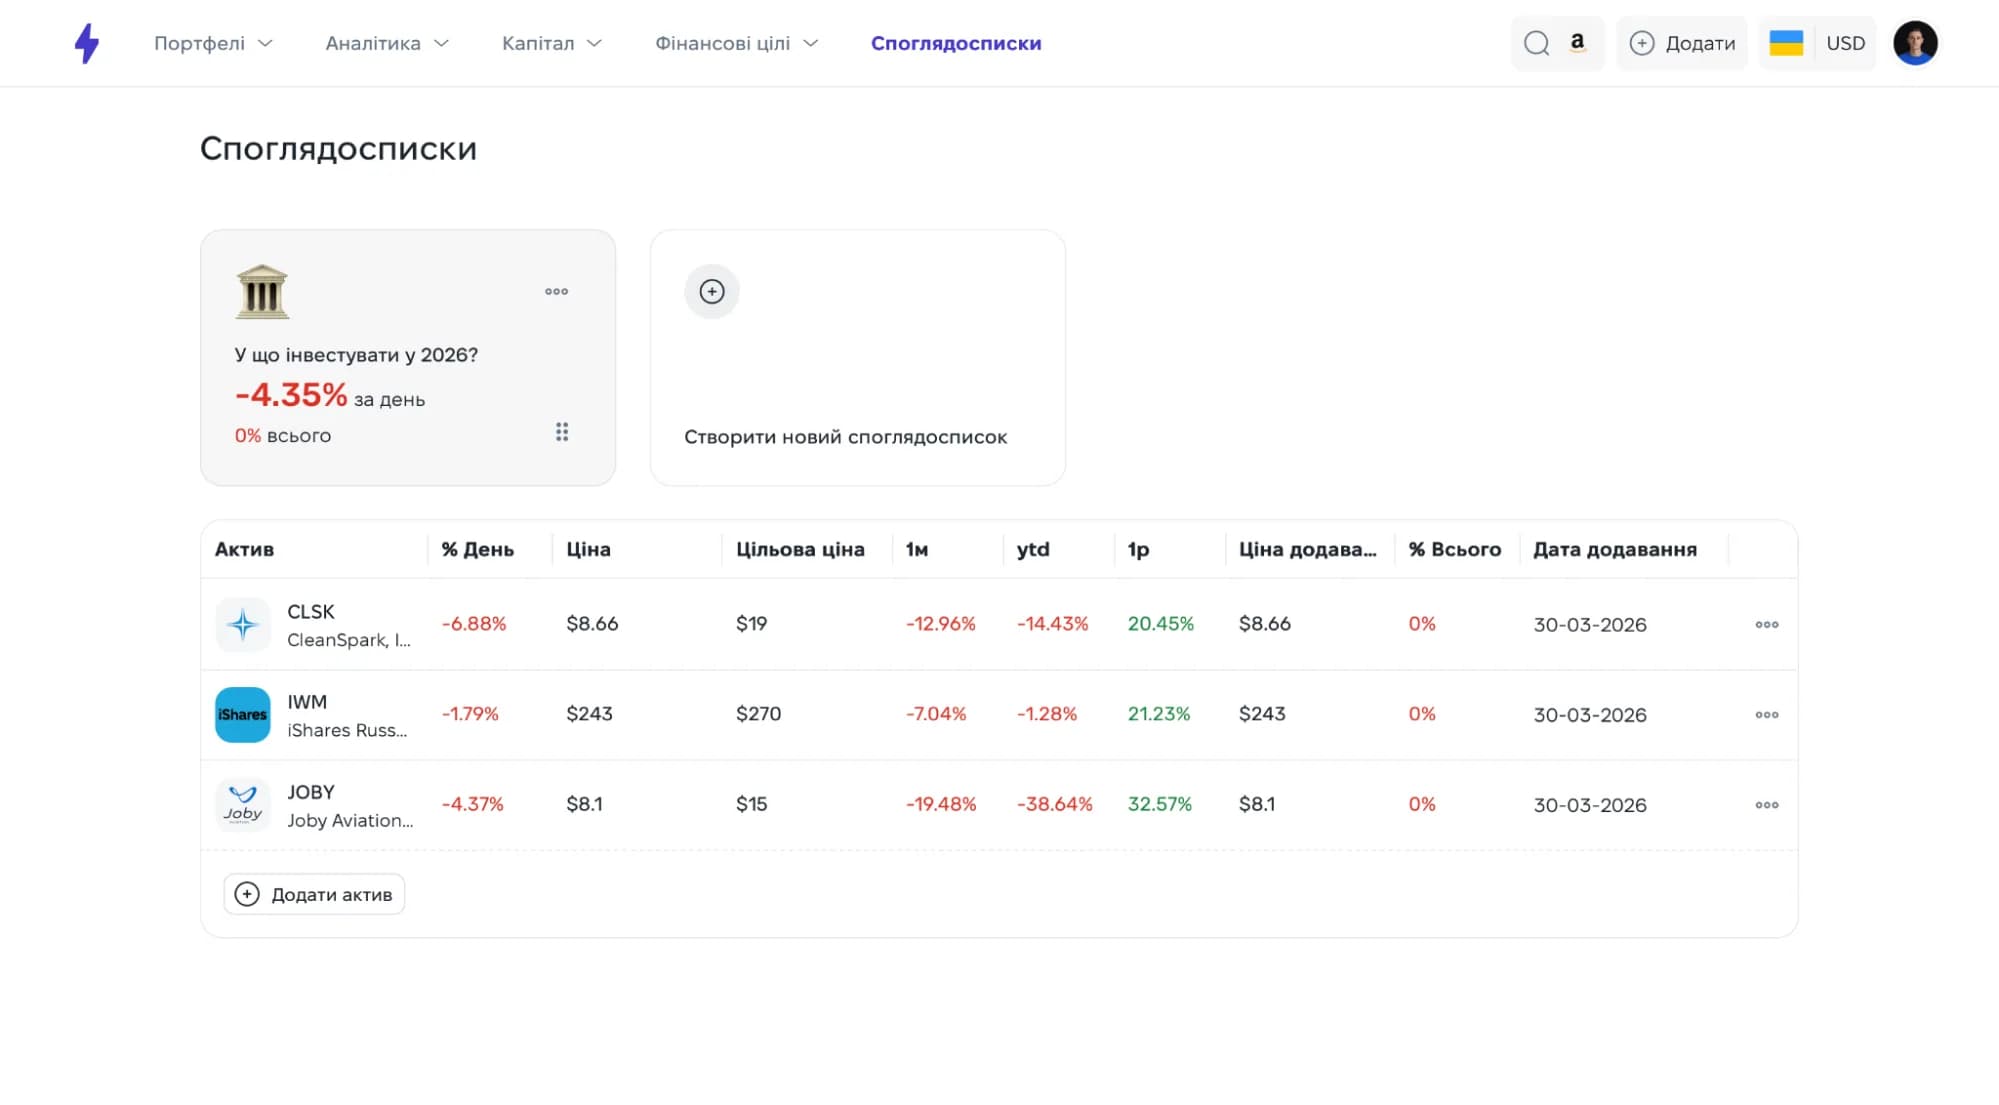
Strum watchlist with target prices and 1m, YTD and 1y price history per ticker

Watchlists

Why use watchlists?

Strum watchlists help users track potential investments before buying. A user records an asset, target price, and interest date, while the service shows price movement, historical performance, and distance to the desired entry point.

FAQ

Frequently asked questions

Think of it as your waiting list. The moment you add an asset, Strum records the price at which you became interested. From then on it automatically shows how far the price has risen or fallen since that day, which helps you avoid emotional purchases and wait for the best moment to trade.

Yes, you can create an unlimited number of themed lists. For example, one for the technology sector, another for crypto assets, or lists built around a strategy such as "Dividend aristocrats" or "Ideas for 2026".

You set your own price at which an asset becomes attractive to you. Instead of simply watching market noise, you always see the exact distance between the current market price and your ideal entry point.

Year to date (YTD) shows how an asset has performed from 1 January of the current year up to today. It is one of the most important measures for comparing the performance of different stocks or ETFs within a single calendar year.

No, these assets are not counted in your real balance. They live separately so that you can analyze the market and test ideas without risking your own money until you decide to actually buy.

The daily change and the current price update in real time. You immediately see the overall volatility of the entire list, which lets you read the general mood of the market at a glance.

Start using Strum for free

One platform for all your portfolios, assets and financial goals.

Start free